|
web and software design for non-profits. |
|
|
tXtFL Bowl 1.0 | 2.0 | 3.0 | 4.0 | 5.0 | 6.0
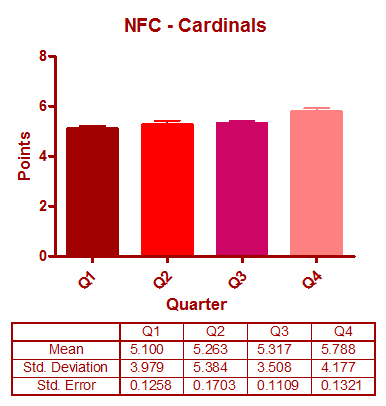
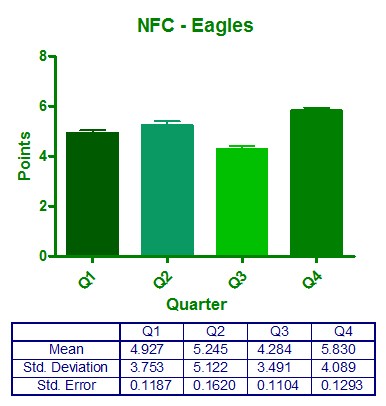
Game Testing: Simulations From tXtFL 1.0preOur goal is to test our football game model...and make some fantasy football predictions while we're at it. New for this round of testing is tXtFL automation mode, where thousands of games can theoretically be run unattended. Game testing for the 1.0 release surrounds the NFC and AFC Championship 2009 games. We'll be running 1000 automated games, aggregating scores by quarter, and predicting a winner. And at the end of the (Sun)day, we'll run some analyses to see how close our model came to the real games. Results | Methods | Analysis | Conclusions Results. Table of automated Arizona Cardinals vs. Philadelphia Eagles gamesQuarter scores and spread
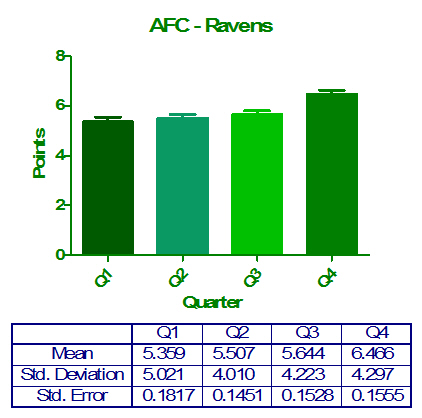
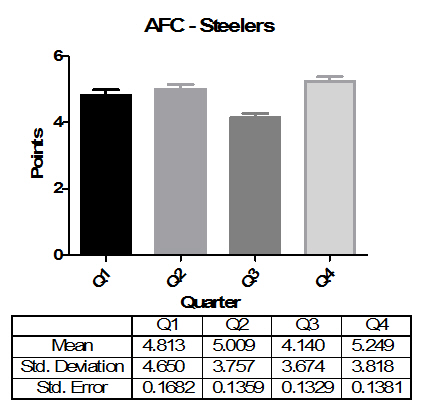
Predicted finals scores and winnerThe final score summary shows the Cardinals besting the Eagles by a very small point spread of 21.468 to 20.286 (see bottom row of results table). 3 touchdowns might just seal the victory for the Cardinals, if their defense can hold the Eagles to pair of TDs and FGs each, or some other combo. Table of automated Baltimore Ravens vs. Pittsburgh Steelers games*Note that only 764 games were completed in time for this simulation. Quarter scores and spread
Predicted finals scores and winnerThe final score summary shows the Ravens besting the Steelers by a very small point spread of 22.975 to 19.211 (see bottom row of results table). Just like with the Carinals, 3 touchdowns might just seal the victory for the Ravens, if their defense can hold the Eagles to less than pair of TDs and FGs each. Methods. Just before crashing for the night, we fired up the simulator, selected "auto" mode, typed in "1000" games, and ran the simulator on the championship teams. In the morning, we ran the GameStatistics utility to aggregate all of the quarter scores for each team. These scores were then imported into GraphPad Prism 5.01 software for graphs and basic statistics. Note that we ran the simulator using the supplied "run.sh" script. This script creates a test environment where we could download players, run games, and delete the directory for a fresh start. The aggregator can be run from the run.sh script using the "--stats" option. Analysis. 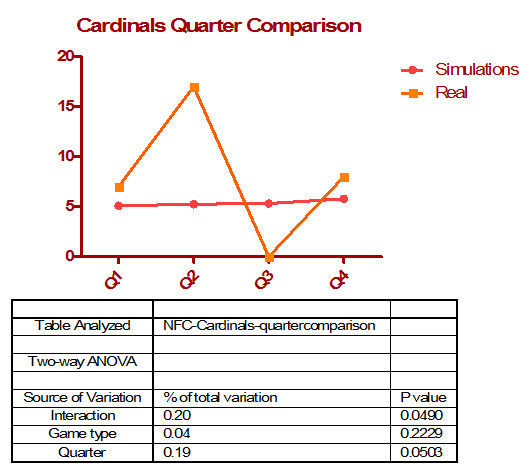
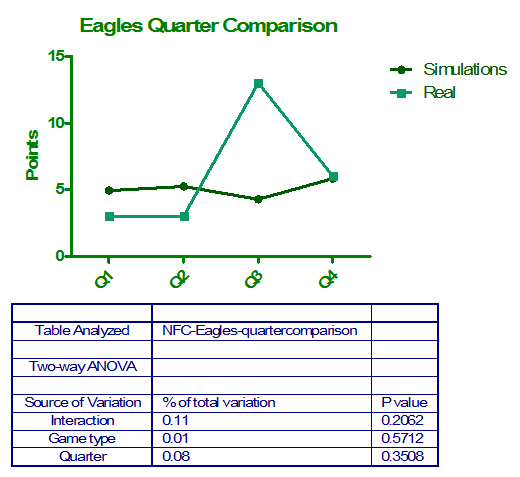
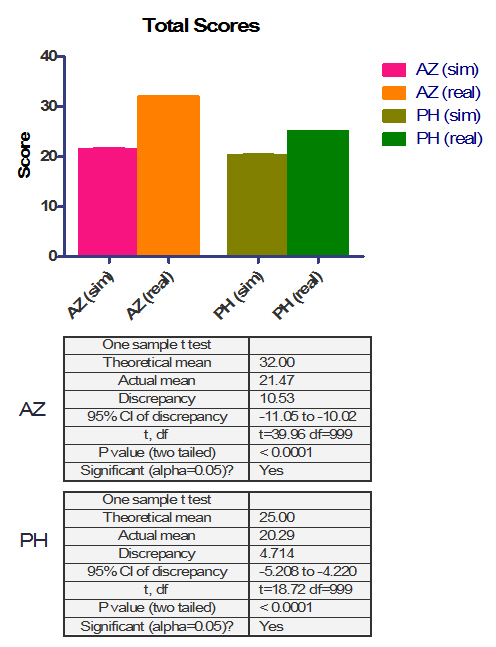
Evidently the simulator didn't think as highly of the teams' offense (or as poorly of their defense) as the real teams did. The quarter comparisons show relatively steady scoring patterns over each quarter, whereas the real game underwent the real dynamics we might expect in the flushed fury of a championship game. Although the 2-way ANOVA analysis showed no statistically signficant interaction of game type (i.e. sim vs. real) and quarter for the Eagles, and only a slightly significant interaction in the Cardinals game, the lack of significance might lie in the low n for real games—i.e. one real, thrilling championship—rather than an actually close approximation to the real thing. We can only hope, however, that running the simulator is at least half as exciting for you as is watching the real thing! The total score plot dramatically reveals the discrepancy between the simulated and real games, although the predicted winner came out to be the same in both cases. The result was far slimmer in the simulated games than in the real NFC Championship, as with the AFC Championship as well. (Alas, the predicted winner during the AFC game did not match the real winner. Best wishes for another year, Joe Flacco.) Conclusion. The simulator allows for a wide range of points (reflected in the standard deviation) but a fairly consistent overall score from quarter to quarter and over hundreds of games. This makes sense given that the model and players remain the same in the simulator throughout the game. But real-life games unfortunately aren't quite like that, with player fatigue as the game wears on, the ebb and flow of morale from score chasing to imminent defeat, and the riskiness of fourth down coaching all playing into the dynamics of the game. The game engine could incorporate these factors in a much more sophisticated model. A running tally of player usage, blocking, and tackle events could contribute to player fatigue. An interaction of score and time could influence team morale, as could the hometown crowd. And team coaching points (already in the tXtFL simulator but not fully applied) could influence play calling and player utilization. This is tXtFL 1.0, and these are some of the goals for tXtFL 2.0! Thanks for joining us for Game Testing 1.0 on the road to Super Bowl XLIII! |
Copyright © 2002-9, Text Flex. | Official stuff. | Contact us.